Category: United States

  • 2011 Residential Telephone Customer Satisfaction Study

    As Outage-Related Issues Take a Toll on Performance and Reliability Satisfaction with Residential Telephone Service, Managing Expectations for Service Restoration Becomes Critical

    2011-09-29

    jdp-root

    WESTLAKE VILLAGE, Calif.: 29 September 2011 — Service outages due to severe winter weather have had a notable negative impact on satisfaction with telephone service performance and reliability among residential customers, according to the JD Power and Associates 2011 U.S. Residential Telephone Customer Satisfaction StudySM released today.


    The study measures customer satisfaction with both local and long distance telephone service in four regions throughout the United States. Five factors are examined to determine overall satisfaction: performance and reliability; cost of service; billing; offerings and promotions; and customer service.


    Satisfaction with performance and reliability—the most influential factor contributing to overall satisfaction—has declined by 6 percent to an average of 7.4 (on a 10-point scale) in 2011 from 7.9 in 2011. Within this factor, satisfaction with the service provider’s ability to keep outages to a minimum has experienced the greatest decline.


    “The brutal winter weather that plagued much of the country clearly took a toll on service levels,” said Frank Perazzini, director of telecommunications at JD Power and Associates. “In fact, the proportion of customers who contacted customer service to report an outage jumped to 21 percent in 2011 from 12 percent in 2010.”


    According to Perazzini, a key driver for mitigating losses in satisfaction due to outages is effectively managing customer expectations regarding service restoration. On average, customers who experience an outage are advised that service will be restored within 30 hours, while actual service restoration time averages 25 hours. Overall satisfaction among customers whose service was restored approximately three hours earlier than the time quoted by the service provider averages 705 on a 1,000-point scale. In comparison, among customers whose service was restored three hours after the estimate given by the provider, satisfaction averages 591.


    The study also finds that among customers who use an alternative phone service (for example, cellular or Internet service, rather than wireline), the proportion who replace wireline telephone calls with cell phone calls, texts and email remains relatively unchanged in 2011, compared with 2010. However, use of Internet calling services such as Skype or Vonage has increased to 21 percent in 2011 from 16 percent in 2010. Customers who use Internet calling services are significantly less satisfied with their telephone provider (622 on average, which is 14 index points below the industry average of 636) and are more likely to switch telephone providers (23% vs. the industry average of 16%).


    Provider results by region are:


    East Region: Cox Communications ranks highest with a score of 659, performing particularly well in performance and reliability; billing; and offerings and promotions. Optimum Voice by Cablevision follows in the region with 647, and Verizon ranks third with 640.


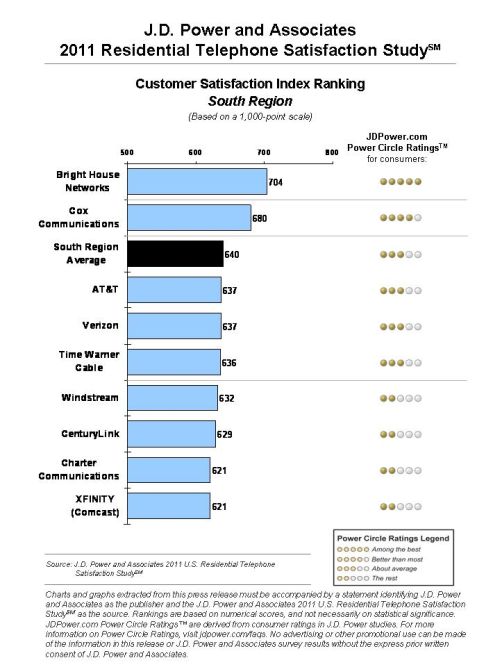
    South Region: Bright House Networks ranks highest in the region with a score of 704 and performs well in all five factors: performance and reliability; customer service; cost of service; billing; and offerings and promotions. Following Bright House Networks in the rankings is Cox Communications (680).


    North Central Region: WideOpenWest (WOW!) ranks highest with 721, performing well in all five factors: performance and reliability; customer service; cost of service; billing; and offerings and promotions. Cincinnati Bell follows in the region with 665, and AT&T ranks third with 631.


    West Region: Cox Communications ranks highest in the region with a score of 669, performing well across all five factors. CenturyLink (639) and Xfinity by Comcast (634) follow in the regional rankings.


    The 2011 U.S. Residential Telephone Customer Satisfaction Study is based on responses from 20,761 customers nationwide who receive their local and long distance telephone service from one provider. The study was fielded in four waves: November 2010, January 2011, April 2011 and July 2011.


    About JD Power and Associates
    Headquartered in Westlake Village, Calif., JD Power and Associates is a global marketing information services company providing forecasting, performance improvement, social media and customer satisfaction insights and solutions. The company’s quality and satisfaction measurements are based on responses from millions of consumers annually. For more information on car reviews and ratings, car insurance, health insurance, cell phone ratings, and more, please visit JDPower.com. JD Power and Associates is a business unit of The McGraw-Hill Companies.


    About The McGraw-Hill Companies
    Founded in 1888, The McGraw-Hill Companies is a leading global financial information and education company that helps professionals and students succeed in the Knowledge Economy. With leading brands including Standard & Poor’s, McGraw-Hill Education, Platts energy information services and JD Power and Associates, the Corporation has approximately 21,000 employees with more than 280 offices in 40 countries. Sales in 2010 were $6.2 billion. Additional information is available at http://www.mcgraw-hill.com.


    No advertising or other promotional use can be made of the information in this release without the express prior written consent of JD Power and Associates. /corporate


    # # #


  • 2011 Pharmacy Satisfaction Study

    Pharmacy Customers Have Higher Expectations for Short Wait Times

    2011-09-20

    jdp-root

    WESTLAKE VILLAGE, Calif.: 20 September 2011 — In addition to expecting more from the pharmacist and pharmacy staff, customers are also expecting shorter wait times, according to the JD Power and Associates 2011 U.S. National Pharmacy StudySM released today.

    The study finds that pharmacy customers have increasingly higher expectations when it comes to wait time. Among chain drug store customers who wait less than 3 minutes to give their prescription information to pharmacy staff, satisfaction averages 836 on a 1,000-point scale, while satisfaction declines to 783 among those who have to wait more than 3 minutes. In comparison, satisfaction in 2010 significantly increased or decreased at 7 minutes.

    “Customers are expecting more from their brick and mortar pharmacy—not just in terms of wait time, but also in terms of contact with the pharmacist and pharmacy staff,” said Rick Millard, senior director of the healthcare practice at JD Power and Associates. “In fact, brick and mortar pharmacies are able to better differentiate themselves by offering additional services from the pharmacy staff. These personal contacts may help distinguish the store experience as satisfying for pharmacy customers.”

    The study, now in its fifth year, measures customer satisfaction with pharmacies in two segments: brick and mortar and mail-order. The brick and mortar segment includes chain drug stores, supermarkets and mass merchandisers. Five key factors that contribute to customer satisfaction with brick and mortar pharmacies are examined: prescription ordering and pick-up process; store; cost competitiveness; non-pharmacist staff; and pharmacist. Four factors are measured in the mail-order segment: cost competitiveness; prescription delivery; prescription ordering; and customer service.

    While customers are considerably less satisfied with chain pharmacies than with supermarkets (808 vs. 826, respectively), satisfaction is lowest with mass merchandiser pharmacies (797). However, mass merchandiser pharmacies perform particularly well in cost competitiveness.

    Mail-Order Segment Findings
    Overall satisfaction with mail-order pharmacies has declined considerably in 2011 from 2010, primarily driven by decreases in satisfaction in the prescription ordering and prescription delivery factor. Despite this decline, fewer mail-order customers than in any year the study has been conducted say they would switch to purchasing prescriptions in a store.

    “In an era when online retailers like Amazon and Zappos have set new standards for speed and convenience, customers are looking for more efficiency in their pharmacy transactions, as well,” said Millard. “There’s a clear opportunity for mail-order pharmacies to improve on the logistical aspects of the transaction.”

    Approximately one-third of customers are required by their insurance provider to use mail-order for maintenance and repeat prescriptions, and these customers are even less satisfied with their pharmacy than are those who are not required to use mail order (771 vs. 836, respectively).

    Mail-order pharmacy customers are significantly more satisfied when they have the ability to request overnight delivery and it is included free of charge. Only 12 percent of mail-order customers say they are aware of and have access to this service.

    Segment Rankings
    Among chain drug store pharmacies, Good Neighbor Pharmacy and Health Mart rank highest in a tie with scores of 851. The Medicine Shoppe Pharmacy follows in the segment rankings with 831.

    Target ranks highest among mass merchandisers for a fifth consecutive year with a score of 846. Sam’s Club (837) and Costco (834) follow in the rankings.

    Publix ranks highest for a second consecutive year in the supermarket segment, with a score of 867. Wegmans follows with 848, and Winn-Dixie ranks third with 834.

    Kaiser Permanente Pharmacy ranks highest among mail-order pharmacies for a third consecutive year with a score of 848. Humana RightSourceRx (840) and Express Scripts (813) follow in the rankings. The Department of Veterans Affairs pharmacy service, which is open only to veterans of the U.S. military and their families, and therefore is not included in the rankings, also achieves a high level of customer satisfaction.

    Millard offers the following tips for pharmacy customers:

    • Some customers benefit from speaking with a pharmacist. Satisfaction is highest among those who are able to have such conversations in a private area. 
    • Mail-order pharmacy customers should check whether there are options to track the order or to arrange for expedited delivery.
    • Sign up for automatic refills if they’re available.
    • Some pharmacy locations offer health testing or wellness services—an added benefit that many customers appreciate.


    The 2011 U.S. National Pharmacy Study is based on responses from more than 12,300 customers who filled a new prescription or refilled a prescription during the three months prior to the survey period. The study was fielded between June and July 2011.

    About JD Power and Associates
    Headquartered in Westlake Village, Calif., JD Power and Associates is a global marketing information services company providing forecasting, performance improvement, social media and customer satisfaction insights and solutions. The company’s quality and satisfaction measurements are based on responses from millions of consumers annually. For more information on car reviews and ratings, car insurance, health insurance, cell phone ratings, and more, please visit JDPower.com. JD Power and Associates is a business unit of The McGraw-Hill Companies.

    About The McGraw-Hill Companies
    Founded in 1888, The McGraw-Hill Companies is a leading global financial information and education company that helps professionals and students succeed in the Knowledge Economy. With leading brands including Standard & Poor’s, McGraw-Hill Education, Platts energy information services and JD Power and Associates, the Corporation has approximately 21,000 employees with more than 280 offices in 40 countries. Sales in 2010 were $6.2 billion. Additional information is available at http://www.mcgraw-hill.com.

    No advertising or other promotional use can be made of the information in this release without the express prior written consent of JD Power and Associates. /corporate

    # # #


  • 2011 Wireless Traditional Mobile Phone Satisfaction Study

    The Right Blend of Design and Technology is Critical to Creating an Exceptional User Experience with Smartphones and Traditional Mobile Devices

    2011-09-07

    jdp-root

    WESTLAKE VILLAGE, Calif.: 8 September 2011 — Overall satisfaction with smartphones and traditional mobile phones is considerably higher for devices that are a specific size and weight and are equipped with the latest technological advancements, such as high-quality display screens, faster processing speeds, longer battery life and touch screen capabilities, according to the JD Power and Associates 2011 U.S. Wireless Smartphone Customer Satisfaction StudySM–Volume 2 and the JD Power and Associates 2011 U.S. Wireless Traditional Mobile Phone Satisfaction StudySM–Volume 2, both released today.
    Satisfaction with both smartphones and traditional or “feature” phones is greatly impacted by the physical design and dimensions of the device. For example, satisfaction ratings are highest (8.1 on a 10-point scale) when the weight of the smartphone device does not exceed 5 ounces. In comparison, satisfaction averages 7.6 for smartphone devices that are 5 ounces or heavier. The same scenario holds true for feature phones, for which satisfaction with the weight of the device peaks between 3 and 3.5 ounces, and drops considerably when the feature phone weighs 4 ounces or more.
    The width and thickness of the smartphone device are also critical in maximizing the ownership experience, and echo the old adage that “thinner is better” holds true. Overall physical design satisfaction is highest (852 on a 1,000-point scale) for smartphones that are less than 0.45 inches wide. In comparison, satisfaction averages 783 for smartphones that are 0.65 inches wide or wider.
    Technology advancements also impact the experience of mobile devices in a number of areas. For example, touch screen-only smartphones generate considerably higher satisfaction with ease of operation (817 points) than either QWERTY-only based devices or those that have both a touch screen and QWERTY functions (785 and 782 points, respectively).
    In addition, faster processing speeds, higher computer chip bit rates and the most advanced display screens (such as Super AMOLED vs. older LCD-based screens) all add significantly to user satisfaction. Even the number of megapixels found in camera-enabled mobile devices influences the ownership experience. In general, the higher the number of megapixels, the higher the satisfaction with camera picture and video quality. However, devices with at least 5 megapixels achieve nearly as high a satisfaction score as those smartphones with 8 megapixels or more.
    “It’s not unexpected that satisfaction is higher for devices that have new technological advances or features,” said Kirk Parsons, senior director of wireless services at JD Power and Associates. “Having the right combination of physical dimensions and operating functions and features for both smartphones and traditionally equipped devices is key to creating an exceptional ownership experience with each type of wireless device.”
    These two studies have been updated to measure customer satisfaction with traditional wireless handsets and smartphones among owners who have used their current mobile phone for less than one year by examining several key factors. In order of importance, the key factors of overall satisfaction with traditional wireless handsets are: performance (31%); ease of operation (24%); physical design (24%); and features (20%). For smartphones, the key factors are: performance (35%); ease of operation (24%); features (21%); and physical design (20%).
    For a sixth consecutive time, Apple ranks highest among manufacturers of smartphones in customer satisfaction. Apple achieves a score of 838 and performs well in all factors, particularly in ease of operation and features. HTC (801) follows Apple in the smartphone rankings.
    Samsung ranks highest in overall customer satisfaction with traditional handsets with a score of 718. Samsung performs well in three factors: performance, ease of operation and features. LG (717), Sanyo (716) and Sony Ericsson (709) follow Samsung in the traditional handset rankings.
    The studies also find the following key wireless handset usage patterns:
    • The price of a traditional wireless mobile phone continues to decline and averages $71 in 2011, compared with an average of $81 at the beginning of 2009. The decline is primarily due to discounts provided by handset providers and wireless service carriers to incentivize sales. Currently, 42 percent of owners report having received a free mobile phone when subscribing to a wireless service.
    • Mobile applications continue to enhance the smartphone user experience. More than two-thirds of owners say they have downloaded games and social networking applications to their device. More than one-half (54%) say they have downloaded entertainment-oriented applications, while 52 percent indicate having downloaded travel software, such as maps and weather applications. This indicates that smartphone owners are continuing to integrate their device usage into both their business and personal lives.
    • Customers are highly satisfied with 4G-capable devices. Satisfaction among customers using 4G-capable phones averages 819, compared with 786 among customers using phones with 3G capability. Owners of 4G devices are also more active in terms of calling, texting and browsing the Internet.
     
    The 2011 U.S. Wireless Smartphone Customer Satisfaction Study–Volume 2 and the 2011 U.S. Wireless Traditional Mobile Phone Satisfaction Study–Volume 2 are based on experiences reported by 6,898 smartphone owners and 8,775 traditional mobile phone owners. Both studies were fielded between January and June 2011.
    About JD Power and Associates
    Headquartered in Westlake Village, Calif., JD Power and Associates is a global marketing information services company providing forecasting, performance improvement, social media and customer satisfaction insights and solutions. The company’s quality and satisfaction measurements are based on responses from millions of consumers annually. For more information on car reviews and ratings, car insurance, health insurance, cell phone ratings, and more, please visit JDPower.com. JD Power and Associates is a business unit of The McGraw-Hill Companies.
    About The McGraw-Hill Companies
    Founded in 1888, The McGraw-Hill Companies is a leading global financial information and education company that helps professionals and students succeed in the Knowledge Economy. With leading brands including Standard & Poor’s, McGraw-Hill Education, Platts energy information services and JD Power and Associates, the Corporation has approximately 21,000 employees with more than 280 offices in 40 countries. Sales in 2010 were $6.2 billion. Additional information is available at http://www.mcgraw-hill.com.
    No advertising or other promotional use can be made of the information in this release without the express prior written consent of JD Power and Associates. /corporate

    # # #


  • 2011 US National Homeowners Insurance Study

    While Relatively Few Homeowners in Catastrophe-Prone Areas Have Earthquake or Flood Insurance Coverage, Those with Flood Insurance Are Significantly Less Satisfied with Their Policies Overall

    2011-09-01

    jdp-root

    WESTLAKE VILLAGE, Calif.: 1 September 2011 — Among homeowners insurance policyholders, those with flood insurance tend to be significantly less satisfied with their policy coverage, compared with policyholders who opt not to carry it, according to the JD Power and Associates 2011 U.S. National Homeowners Insurance StudySM released today.

    Now in its 11th year, the study measures customer satisfaction with homeowners insurance companies by examining five key factors: policy offerings; price; billing and payment; interaction; and claims.

    Fewer than one in 10 homeowners insurance customers in New England and the Mid-Atlantic states report carrying flood insurance prior to Hurricane Irene. While a higher proportion of policyholders in the Gulf states—more than 25 percent—carry flood coverage either through their homeowners insurance company, state flood plans or another provider, this is still a relatively low proportion, considering the frequency of hurricanes and other severe weather events in the region.

    Among homeowners who carry flood insurance, overall satisfaction with their homeowners insurance company averages 735 on a 1,000-point scale in 2011. In comparison, satisfaction among homeowners with earthquake insurance coverage averages 766.

    “So far, 2011 has been a tough year for the property insurance industry due to the occurrence of multiple natural catastrophes—ranging from tornadoes in the southern U.S. in the spring, to massive flooding in the Midwest, to the recent earthquake on the East Coast, followed by Hurricane Irene—which have driven home the necessity among many U.S. consumers of having adequate homeowners insurance coverage,” said Jeremy Bowler, senior director of the insurance practice at JD Power and Associates.

    According to Bowler, it is key for homeowners to ensure that their insurance coverage is sufficient before a disaster strikes. While many homeowners may not give much thought to their insurance under normal circumstances, the moment they have to file a claim, the value of coverage becomes realized. The study finds that customers who have filed a claim tend to be more knowledgeable about their policies—and also more satisfied—than those who haven’t had a claims experience. 

    “Unfortunately, the majority of homeowners affected by Hurricane Irene were not covered for flood damage, and many may find their claims denied,” said Bowler.

    The study finds that approximately 16 percent of homeowners insurance policyholders indicate they carry less coverage than would be required to fully rebuild their home in the event of a total loss. Among these policyholders, satisfaction averages 739—more than 40 points lower than among policyholders who say they have sufficient coverage.

    Overall satisfaction with homeowners insurance companies averages 769 in 2011—improving by 19 points from 2010. While satisfaction has improved in all five factors from 2010, the greatest gain occurs in the interaction factor. Despite these gains, customer satisfaction with homeowners insurance companies remains significantly below satisfaction with auto insurance companies, which averages 790 in 2011, according to the JD Power and Associates National Auto Insurance StudySM, published in June.

    Customer satisfaction with homeowners insurance companies has rebounded from 2010, but still remains below levels achieved in 2009.  Similarly, among auto insurance policyholders, satisfaction has improved notably from 2010. While satisfaction also increased in all five factors among auto insurance customers, one key difference has emerged between homeowners insurance customers and auto insurance customers in 2011. Among homeowners insurance customers, those who bundle more than one policy with their insurer are notably more satisfied with price than customers who do not bundle policies. Among auto insurance customers, the opposite is true—those who hold only their auto policy with their insurer are notably more satisfied with price than those who bundle policies.

    “Certain auto insurers have deemphasized the benefits of policy bundling in favor of selling auto-only policies,” said Bowler. “These auto insurers, while able to gain an advantage on pricing, are serving only a portion of the market. The higher levels of satisfaction observed among homeowners policyholders who have more than one policy with their insurer indicate they derive benefit—such as discounts and a wider array of product offerings—than do non-bundlers.”

    Amica Mutual ranks highest for a 10th consecutive year among homeowners insurance companies and performs particularly well in all five factors that contribute to overall customer satisfaction. Following Amica Mutual in the rankings are Auto-Owners Insurance and Erie Insurance (in a tie), Cincinnati Insurance, State Farm, and American Family, respectively. USAA, an insurance provider open only to U.S. military personnel and their families and therefore not included in the rankings, also achieves a high level of customer satisfaction.

    JD Power and Associates offers the following tips to homeowners insurance policyholders:

    • If your insurance company doesn’t offer one, request an annual policy review. One of the most important topics to cover during the review is whether your policy limit is adequate to cover the full replacement cost value of your home. Make sure you inquire about additional policy lines, such as earthquake and flood insurance, if they are appropriate for you.
    • Ask your insurance company about the discounts they offer, such as those for multiple policies, having smoke or fire alarms, or for being a long-time customer.
    • While it’s convenient to access billing and payment information through your insurer’s website, don’t rely solely on the website to communicate with your insurance company. If you have a problem or a non-billing issue to discuss, you may have a more satisfying experience if you call and talk directly to an agent or representative. Likely, they can answer your question quickly and efficiently, and save time you might spend hunting for the answer on a website.

    The 2011 U.S. National Homeowners Insurance Study is based on responses from more than 9,100 homeowners insurance customers. The study was fielded between April and July 2011.

    About JD Power and Associates
    Headquartered in Westlake Village, Calif., JD Power and Associates is a global marketing information services company providing forecasting, performance improvement, social media and customer satisfaction insights and solutions.  The company’s quality and satisfaction measurements are based on responses from millions of consumers annually. For more information on car reviews and ratings, car insurance, health insurance, cell phone ratings, and more, please visit JDPower.com. JD Power and Associates is a business unit of The McGraw-Hill Companies.

    About The McGraw-Hill Companies
    Founded in 1888, The McGraw-Hill Companies is a leading global financial information and education company that helps professionals and students succeed in the Knowledge Economy.  With leading brands including Standard & Poor’s, McGraw-Hill Education, Platts energy information services and JD Power and Associates, the Corporation has approximately 21,000 employees with more than 280 offices in 40 countries.  Sales in 2010 were $6.2 billion. Additional information is available at http://www.mcgraw-hill.com.

    No advertising or other promotional use can be made of the information in this release without the express prior written consent of JD Power and Associates. /corporate

    # # #


  • 2011 Wireless Network Quality Study

    Overall Wireless Network Problem Rates Differ Considerably Based on Type of Usage Activity

    2011-08-25

    jdp-root

    WESTLAKE VILLAGE, Calif.: 25 August 2011 — Overall network performance levels for wireless handsets differ depending on whether devices are used for voice calling, text messaging or data service, according to the JD Power and Associates U.S. 2011 Wireless Network Quality Performance StudySM—Volume 2 released today.

    The study finds that overall network performance varies widely by the type of activity being performed on the handset. For example, there are more reported problems among wireless customers while placing calls, compared with messaging and data-related activities. Overall, problems associated with calling, such as dropped calls, initial disconnects and audio issues, average 18 PP100. This compares with a reported 16 PP100 average for data-related issues, such as Web and email connection errors and excessively slow downloads. An even lower PP100 average is reported for messaging problems (5 PP100), such as transmission failures and late text messages.

    In addition, the specific types of problems experienced can vary greatly within each usage type. Among customers who report data-related issues, there are more reported problems for excessively slow downloads (19 PP100), compared with Web connection failures (11 PP100) or email failures (6 PP100). The same holds true for specific problems associated with making calls. There are more reported problems related to general audio issues, such as interference or voice distortion, compared with failed/late voice messages (8 PP100 vs. 5 PP100, respectively).

    “Based on the varying degree of consistency with overall network performance, it’s critical that wireless carriers continue to invest in improving both the voice quality and data connection-related issues that customers continue to experience,” said Kirk Parsons, senior director of wireless services at JD Power and Associates.

    According to Parsons, there is a financial impact in providing a high-performing network, as spending increases by an average of $10 per customer among those who have switched from a previous carrier to obtain a better network/coverage, compared with those who leave for other reasons.

    Now in its ninth year, the semiannual study has been expanded in 2011 to collect evaluations from wireless customers’ most recent usage activities in three areas that impact the network performance: calling, messaging and data. Overall network performance is based on 10 problem areas that impact the customer experience: dropped calls; calls not connected; audio issues; failed/late voicemails; lost calls; text transmission failures; late text message notifications; Web connection errors; email connection errors; and slow downloads. Network performance issues are measured as problems per 100 (PP100) network connections, where a lower score reflects fewer problems and better network performance. Carrier performance is examined in six regions: Northeast; Mid-Atlantic; Southeast; North Central; Southwest; and West.

    For a 14th consecutive reporting period, Verizon Wireless ranks highest in the Northeast region. Verizon Wireless achieves fewer customer-reported problems with dropped calls, initial connections, transmission failures and late text messages, compared with the regional averages. Verizon Wireless also ranks highest in the Mid-Atlantic, Southeast, Southwest and West regions.

    In the North Central region, U.S. Cellular ranks highest for a 12th consecutive reporting period. Compared with the regional average, U.S. Cellular has fewer customer-reported problems with dropped calls, failed initial connections, audio problems, failed voice mails and lost calls.

    Additional study findings include:

    • Wireless usage patterns continue to evolve, as fewer calls are being made or received. On average, wireless customers use 450 minutes per month, a decline of 77 minutes from 527 in 2009. Customers are using their devices more often for text messaging. The study finds that wireless customers sent/received an average of 39 text messages during an average two-day period. During the course of a month, this equals more than 500 incoming/outgoing text messages.
       
    • On average, smartphone customers continue to experience more problems than do traditional handset customers–14PP100 vs. 12PP100, respectively. However, the largest gaps in reported problem rates occur with both calling and data activity. In these areas, problem rates among smartphone customers average 4 PP100 higher than among traditional device customers.
       
    • Among the top 30 U.S. markets, average problem rates are lowest among wireless customers in the Salt Lake City market (9 PP100), and highest among wireless customers in the Sacramento market (16 PP100).

    The 2011 Wireless Network Quality Performance Study—Volume 2 is based on responses from 22,110 wireless customers. The study was fielded between January and June 2011.

    For more information on customer satisfaction with wireless service, wireless retail sales, cell phone handsets, customer care, prepaid wireless service and business wireless service, please visit JDPower.com.

    About JD Power and Associates
    Headquartered in Westlake Village, Calif., JD Power and Associates is a global marketing information services company providing forecasting, performance improvement, social media and customer satisfaction insights and solutions. The company’s quality and satisfaction measurements are based on responses from millions of consumers annually. For more information on car reviews and ratings, car insurance, health insurance, cell phone ratings, and more, please visit JDPower.com. JD Power and Associates is a business unit of The McGraw-Hill Companies.

    About The McGraw-Hill Companies
    Founded in 1888, The McGraw-Hill Companies is a leading global financial information and education company that helps professionals and students succeed in the Knowledge Economy. With leading brands including Standard & Poor’s, McGraw-Hill Education, Platts energy information services and JD Power and Associates, the Corporation has approximately 21,000 employees with more than 280 offices in 40 countries. Sales in 2010 were $6.2 billion. Additional information is available at http://www.mcgraw-hill.com.

    No advertising or other promotional use can be made of the information in this release without the express prior written consent of JD Power and Associates. /corporate


  • 2011 Credit Card Satisfaction Study

    Customer Satisfaction with Credit Cards Increases for a Second Year

    2011-08-18

    jdp-root

    WESTLAKE VILLAGE, Calif.: 18 August 2011 — After a considerable decline in 2009, credit card customer satisfaction has increased for a second year, according to the JD Power and Associates 2011 U.S. Credit Card Satisfaction StudySM released today.

    The study, now in its fifth year, measures customer satisfaction with credit cards by examining six key factors: interaction; credit card terms; billing and payment process; rewards; benefits and services; and problem resolution. Overall credit card satisfaction averages 731 on a 1,000-point scale in 2011, up from 714 in 2010 and 705 in 2009.

    American Express ranks highest in customer satisfaction for a fifth consecutive year with a score of 786 and performs particularly well in the benefits and services, credit card terms and rewards factors. Discover Card follows with a score of 779, and performs well in the interaction factor. Barclaycard ranks third with 739.

    Satisfaction improves across all factors, with substantial increases in satisfaction with problem resolution and credit card terms. In the problem resolution factor, customers report fewer problems—11 percent in 2011, compared with 14 percent in 2010. Additionally, any problems that do occur tend to be resolved more quickly this year (4.9 days vs. 5.8 in 2010) and require fewer contacts (1.8 contacts vs. 2.2 in 2010).

    Customer perceptions of card issuer brand image have also improved in 2011. Overall reputation of brands in the industry has increased again this year, as measured across six attributes, with financial stability showing the greatest increase from 2010.

    “While the perception of credit card brands has increased from last year, this strong upward indicator could certainly turn, given the highly volatile markets of late,” said Michael Beird, director of banking services at JD Power and Associates.

    The improvement in credit card satisfaction may be attributed to a decline in interest rate increases reported, as well as a decrease in the impact of interest rate increases on overall satisfaction. In addition, 35 percent of customers say they understand their credit card terms—up from 32 percent in 2010.

    “It appears that credit card companies are doing a better job of communicating with customers, which may be an effect of the CARD Act,” said Beird. “This improved communication is key to ensuring that customers fully understand their credit card terms—particularly benefits and fees—which helps reduce the number of problems reported and improves the overall experience.”

    While satisfaction among transactors (customers who always or usually pay their entire credit card balance each month) declined in 2010, satisfaction in 2011 has improved among both transactors and revolvers (customers who typically carry account balances).

    According to Beird, even with improved communication and higher satisfaction across the industry, there is still a wide variance among credit card companies, and competition for acquiring new cardholders has increased during the past year. As a result, consumers should do all they can to arm themselves with knowledge when considering a new credit card.

    “The improvements in the industry around more proactive and transparent communication create a more level playing field, but only if consumers educate themselves,” said Beird, who offers these tips:

    • Know what kind of credit card user you are and choose a card that fits your habits. Do you tend to carry a balance over time (revolvers) or pay it off every month (transactors)?  Revolvers should look for the most competitive credit terms on balances and payments instead of an attractive rewards program. Transactors, however, should look at rewards programs that make it easy to both earn and redeem rewards. Both types of customers should search for programs that provide the best overall benefits and services for their needs.
       
    • Do your homework online, in person and over the phone. Ask questions and read materials about the card program you are interested in. Do not overlook online blogs and websites, including JDPower.com, that objectively evaluate card issuers and program terms and include customer feedback.
       
    • Explore what other customer tools and resources are available. Many issuers now offer a wide range of online tools for financial planning and debt management, as well as payment and purchase tracking. Some also offer credit counseling, sophisticated mobile applications, online chat and other forms of real-time assistance to fit their customers’ lifestyles.
       
    • Do not be afraid to test customer service before applying. While the Internet continues to be a critical interaction channel for credit card customer service, talking to agents via the phone is still the primary channel for addressing questions and problems. Before you apply, call the customer service line to see how user-friendly and helpful the service is.

    The 2011 U.S. Credit Card Satisfaction Study is based on responses from more than 8,700 credit card customers. The study was fielded in May and June 2011.

    About JD Power and Associates
    Headquartered in Westlake Village, Calif., JD Power and Associates is a global marketing information services company providing forecasting, performance improvement, social media and customer satisfaction insights and solutions. The company’s quality and satisfaction measurements are based on responses from millions of consumers annually. For more information on car reviews and ratings, car insurance, health insurance, cell phone ratings, and more, please visit JDPower.com. JD Power and Associates is a business unit of The McGraw-Hill Companies.

    About The McGraw-Hill Companies
    Founded in 1888, The McGraw-Hill Companies is a leading global financial information and education company that helps professionals and students succeed in the Knowledge Economy. With leading brands including Standard & Poor’s, McGraw-Hill Education, Platts energy information services and JD Power and Associates, the Corporation has approximately 21,000 employees with more than 280 offices in 40 countries. Sales in 2010 were $6.2 billion. Additional information is available at http://www.mcgraw-hill.com.

    No advertising or other promotional use can be made of the information in this release without the express prior written consent of JD Power and Associates. /corporate


  • 2011 Texas Residential Retail Electric Provider Customer Satisfaction Study

    Overall Customer Satisfaction with Residential Retail Electric Service Providers in Texas Increases for a Third Consecutive Year

    2011-08-17

    jdp-root

    WESTLAKE VILLAGE, Calif.: 17 August 2011 — For a third consecutive year, overall satisfaction has improved among residential customers of electric retailers in Texas, largely due to declining bill amounts, according to the JD Power and Associates 2011 Texas Residential Retail Electric Provider Customer Satisfaction StudySM released today.

    The study, now in its fourth year, measures customer satisfaction with retail electric utility providers in Texas by examining four key factors (listed in order of importance): price; billing and payment; communications; and customer service.

    Overall satisfaction among residential customers of electric retailers in Texas has increased to 659 on a 1,000-point scale in 2011–up by 25 points from 2010 and 30 points from 2009. While satisfaction has improved in 2011 in all four factors examined in the study, satisfaction with price improves most notably to an average of 644, increasing by 34 points from 2010. During the past several years, customer-reported bill amounts have declined steadily from a median of $167 in 2009 to $156 in 2010 and $150 in 2011. These price decreases are primarily due to declining natural gas prices.

    “A primary goal of the Texas electric retail market–to serve customers better through competition and choice–is one that retailers have fulfilled during the past three years, reflected by steady increases in overall satisfaction scores,” said Chris Oberle, senior director of the energy and utility practice at JD Power and Associates.

    Satisfaction with the billing and payment factor has also improved considerably, up 31 points from 2010. Contributing to this increase is a shift in payment methods, with a higher proportion of customers choosing to pay their utility bill electronically rather than by mail. Approximately 46 percent of customers indicate paying their bill either through a financial institution or utility website, while 23 percent of customers mail their payments. Satisfaction among customers who use online and electronic payment methods (recurring bank or credit card debits) is considerably higher than among customers using traditional methods (mail, phone or in-person payment).

    “Alternative payment methods have become more satisfying than ever,” said Oberle. “Electric retailers could raise satisfaction even further by encouraging more customers to investigate and use online and other alternative payment options.”

    The study also finds that, among customers who are aware of their retailer’s corporate citizenship efforts–such as supporting local organizations or volunteering in the community–satisfaction averages 80 points higher than among customers who are not aware of these efforts.

    “Only one in six customers are aware of their retailer’s local citizenship efforts,” said Oberle. “There is ample opportunity for retailers to show how dedicated they are to the communities in which they do business, which can positively affect satisfaction levels.”

    Champion Energy Services ranks highest among retail electric utility providers in Texas for a second consecutive year and achieves a score of 745. Champion Energy Services performs particularly well in the price and billing and payment factors. Following in the rankings are Spark Energy (740) and StarTex Power (739). StarTex Power performs particularly well in the billing and payment and customer service factors.

    The study finds that providing highly satisfying service can result in higher rates of customer recommendation and customer loyalty. The highest-ranking brands in the study also have the highest proportions of customers who say they “definitely will” recommend their current provider. In addition, as overall satisfaction improves, the propensity of customers to switch retailers declines.

    “Retail electric customer satisfaction is a continually changing process, in terms of improving pricing and presenting better offerings and promotions,” said Oberle. “As competitive pressures grow in the Texas retail market, providers will need to continue to maintain long-term relationships with their current customers, as well as to implement and improve innovation. By developing new strategies and brand awareness among new customers, retail providers can help ensure they stay loyal and committed, which helps them maintain a positive brand image and attract and enroll more new customers.”

    The study also includes the following key findings:

    • Nearly one-fourth of all Texas retail households (24%) say they have a smart meter installed at their home.  Satisfaction among customers with a smart meter is higher (685, on average) than among those without a smart meter (662).
    • Among customers with a smart meter, 16 percent have registered it at the Web portal SmartMeterTexas.com, which allows them to access detailed views of their electricity usage.  Satisfaction is substantially higher among customers who register their smart meter at this Web portal (756) than among smart meter customers without access to their detailed usage information (671).

    JD Power and Associates offers the following tips to consumers who are shopping for an electric retailer:

    • It pays to shop around before deciding on an electric retailer. Customers who consider more than one electric retailer are substantially more satisfied than those who only consider one retailer.
    • While there are several information sources to choose from when shopping, consider looking for newspaper or magazine articles. Electric retailer customers in Texas who refer to articles when they shop for a provider are more satisfied than customers who rely on advertising, the retailer’s reputation or information gathered from the Texas Choice website.
    • It may be tempting to choose a retailer based solely on low prices, but this could result in being less satisfied. Customers who choose their retailer based on good customer service are notably more satisfied than those who make their decisions based on low price, reputation, past experience with a retailer or recommendations from family or friends.
    • Select your payment plan carefully. Customers who opt for a fixed rate plan–which guarantees a set rate during the entire length of the contract–are much more satisfied than customers who choose a variable price plan.
    • If you’re dissatisfied with your current electric retailer, consider switching. Among customers who rated their previous provider as “unacceptable” (one point on a 10-point scale) and switched to a new provider, satisfaction soars to an average of 747–nearly 90 points higher than the industry average.

    The 2011 Texas Residential Retail Electric Provider Customer Satisfaction Study is based on responses from more than 8,100 residential customers of electric retailers in Texas. The study was fielded between September 2010 and June 2011.

    For more information, view Texas residential retail electric service provider ratings at JDPower.com.

    About JD Power and Associates
    Headquartered in Westlake Village, Calif., JD Power and Associates is a global marketing information services company operating in key business sectors including market research, forecasting, performance improvement, Web intelligence and customer satisfaction.  The company’s quality and satisfaction measurements are based on responses from millions of consumers annually.  For more information on car reviews and ratings, car insurance, health insurance, cell phone ratings, and more, please visit JDPower.com. JD Power and Associates is a business unit of The McGraw-Hill Companies.

    About The McGraw-Hill Companies
    Founded in 1888, The McGraw-Hill Companies is a leading global financial information and education company that helps professionals and students succeed in the Knowledge Economy.  With leading brands including Standard & Poor’s, McGraw-Hill Education, Platts energy information services and JD Power and Associates, the Corporation has approximately 21,000 employees with more than 280 offices in 40 countries.  Sales in 2010 were $6.2 billion.  Additional information is available at http://www.mcgraw-hill.com.

    No advertising or other promotional use can be made of the information in this release without the express prior written consent of JD Power and Associates. /corporate

    # # #


  • 2011 Wireless Purchase Experience

    Satisfaction with the Wireless Purchase Experience Differs Considerably Among Sales Channels

    2011-08-11

    jdp-root

    WESTLAKE VILLAGE, Calif: 11 August 2011 — Overall satisfaction with the wireless purchase experience differs across contact channels stemming from consumer channel expectations and the transaction type, according to the JD Power and Associates 2011 U.S. Full-Service Wireless Purchase Experience StudySM—Volume 2 and the 2011 U.S. Wireless Non-Contract Purchase Experience StudySM—Volume 2, both released today.

    Now in their eighth year, the semiannual studies have been expanded in 2011 to collect evaluations from customers who recently had a wireless purchase experience using any of three contact methods: telephone calls with sales representatives; visits to a retail wireless store; and on the Web. Overall customer satisfaction with both full-service and non-contract branded carriers is based on six factors (in order of importance): store sales representative; website sales; phone sales representative; store facility; offerings and promotion; and cost of service.

    The study finds that overall customer satisfaction varies widely by the type of channel used for their wireless sales transaction. Satisfaction is lowest among customers who most recently conducted a Web sales transaction (738 on a 1,000-point scale, on average), compared with retail (walk-in) and telephone channels (753 and 752, respectively). Customers who purchased through the Web channel, where finding information quickly is more challenging, tend to rate their experience lower based on the general lack of personal assistance, compared with either in-person or over the phone.

    In addition, the study finds that satisfaction with cost of service and offerings and promotions is lower when purchases are made over the phone than when made online or in stores. For example, satisfaction with cost of service among purchases occurring over the phone averages 626, compared with 653 and 652 when purchases occur online and in stores, respectively. Similarly, satisfaction with offerings and promotions for purchases made over the phone averages 12 points lower than for online purchases and 17 points lower than for in-store purchases. Customers making purchases online and in stores have the opportunity to view all product offerings and see the pricing associated with each one, which is not always possible over the phone.  

    “Within the past year, there have been a number of new product and service plan innovations where, in most cases, relatively detailed information needs to be provided to customers in a logical and cost-effective manner,” said Kirk Parsons, senior director of wireless services at JD Power and Associates. “Being able to provide a seamless experience across multiple sales channels is key for service carriers, particularly as devices and plans become more complex. Providing up-to-date product and service information is becoming increasingly critical to exceeding customer expectations.”

    Overall satisfaction also differs by the method of purchase, as expectations are set by the type of purchase being made. For example, satisfaction is 775 among full-service customers who change their service plan via the phone, compared with just 716 among those opting to do so online. However, overall satisfaction scores do not vary by channel when purchasing a new device.

    According to Parsons, full-service carriers that provide an exceptional purchase experience (receiving ratings of 10 on a 10-point scale) may earn $4 more per customer each month, compared with full-service carriers that do not provide a satisfactory experience.

    Sprint and T-Mobile rank highest, in a tie, in customer satisfaction among major full-service wireless carriers with a score of 755 each. Sprint performs well among the website sales, offerings and promotions and cost of service factors. T-Mobile performs particularly well in the cost of service factor.

    Boost Mobile ranks highest in overall purchase experience satisfaction among non-contract service carriers with an overall score of 766. Boost Mobile performs particularly well in phone sales representative, offerings and promotions and cost of service. MetroPCS (760) and Virgin Mobile (753) follow Boost Mobile in the non-contract service carrier rankings.

    The study also finds the following key retail wireless sales transaction patterns:


    • Sixty-two percent of full-service customers indicate that their most recent purchase experience occurred in a retail store location, while 19 percent say that their most recent sales transaction occurred via the telephone or online channel. This differs considerably from non-contract branded customers—26 percent say their most recent purchase transaction occurred online, and only 13 percent indicate that it was over the telephone.
    • The average total time customers spent in the full-service retail store to complete the sales transaction is approximately 53 minutes—a decrease of more than three minutes, compared with six months ago. In comparison, customers making purchases from non-contract carriers indicate spending just 44 minutes in the retail store.
    • Satisfaction with the overall purchase experience among other retailers, such as Apple, Best Buy, Costco, RadioShack and Wal-Mart, averages 740 index points—18 points lower than among stores owned by full-service wireless carriers.


    The 2011 Wireless Full-Service Purchase Experience Study—Volume 2 is based on responses from 9,190 wireless customers. The 2011 Wireless Non-Contract Purchase Experience Study—Volume 2 is based on responses from 1,767 wireless customers. Both studies are among current subscribers who report having a sales transaction with their current carrier within the past six months. The study was fielded from January through June 2011.

    For more information on customer satisfaction with wireless service, wireless retail sales, cell phone handsets, customer care, prepaid wireless service and business wireless service, please visit JDPower.com.

    About JD Power and Associates
    Headquartered in Westlake Village, Calif., JD Power and Associates is a global marketing information services company providing forecasting, performance improvement, social media and customer satisfaction insights and solutions. The company’s quality and satisfaction measurements are based on responses from millions of consumers annually. For more information on car reviews and ratings, car insurance, health insurance, cell phone ratings, and more, please visit JDPower.com. JD Power and Associates is a business unit of The McGraw-Hill Companies.

    About The McGraw-Hill Companies
    Founded in 1888, The McGraw-Hill Companies is a leading global financial information and education company that helps professionals and students succeed in the Knowledge Economy. With leading brands including Standard & Poor’s, McGraw-Hill Education, Platts energy information services and JD Power and Associates, the Corporation has approximately 21,000 employees with more than 280 offices in 40 countries. Sales in 2010 were $6.2 billion. Additional information is available at http://www.mcgraw-hill.com.

    No advertising or other promotional use can be made of the information in this release without the express prior written consent of JD Power and Associates. /corporate

    # # #


  • 2011 Home Appliance Study

    Laundry and Kitchen Appliance Owners Are Increasingly Seeking Brands First, Retailers Second

    1970-01-01

    jdp-root

    WESTLAKE VILLAGE, Calif.: 3 August 2011 — Increasing proportions of home appliance owners say they choose which appliance brand to purchase first, then visit a retailer carrying that brand, rather than selecting the retailer first, according to the JD Power and Associates 2011 Laundry Appliance Satisfaction StudySM and the JD Power and Associates 2011 Kitchen Appliance Satisfaction Study,SM both released today.  

    The extent of this shift in shopping behavior varies slightly by appliance type. For example, the largest increase is observed among owners of ranges, cooktops and ovens. Approximately 44 percent of these owners in 2011 say they selected their appliance brand first, up six percentage points from 2010. The smallest increases occur in the clothes dryer and refrigerator segments, which are up by four percentage points each from 2010.

    “The wide array of product information available, particularly from online sources, makes it easier than ever for appliance shoppers to do research prior to making a purchase,” said Jim Howland, senior director of the real estate and construction industries practice at JD Power and Associates. “Online ratings, for example, are becoming increasingly influential among many appliance shoppers.”

    In addition, appliance owners who research appliance brands and/or select an appliance brand prior to visiting a retailer are notably more satisfied with their appliance than owners who don’t. Among owners who say they researched appliance brands prior to visiting a retailer, satisfaction averages between 20 points and 34 points higher on a 1,000-point scale (depending upon the type of appliance) than among owners who didn’t perform prior research. Satisfaction among owners who select the appliance brand prior to visiting a retailer averages between 14 and 29 points higher than satisfaction among owners who selected the retailer first, then chose a brand carried by the retailer.

    Although shopping behavior is evolving, the study also finds that more traditional sources of shopping information–the owner’s past experience with a brand, in-store product displays and recommendations from salespersons–continue to be very influential among appliance owners.  According to the JD Power and Associates 2011 Appliance Mystery Shopping Report,SM many of the appliance brands that receive high overall satisfaction scores also receive particularly high proportions of strong recommendations from retail salespersons. These recommendations can significantly impact brand choice and market share, particularly when salespersons provide compelling reasons for the recommendation.

    Laundry Appliance Satisfaction Study
    The Laundry Appliance Satisfaction Study measures customer satisfaction with clothes washers and dryers based on performance in six factors: ease of use; features (such as the usefulness of settings available and appliance capacity); performance and reliability (including energy efficiency, noise level and how well the appliance functions); styling and appearance; warranty; and price.

    Clothes Washers
    For a third consecutive year, Samsung ranks highest in satisfying clothes washer owners, achieving a score of 834. Samsung performs particularly well in three of the six factors: ease of use; styling and appearance; and price. Following Samsung in the ranking are LG (827) and Kenmore Elite (825). LG performs particularly well in the warranty factor, while Kenmore Elite performs well in the features factor.

    Clothes Dryers
    Samsung ranks highest in customer satisfaction with clothes dryers for a fourth consecutive year with a score of 830, and performs particularly well in four of the six factors: ease of use; styling and appearance; features; and price. Whirlpool Duet (829) and LG (823) follow Samsung in the ranking. Whirlpool Duet performs particularly well in the performance and reliability and features factors.

    According to mystery shoppers, LG, Samsung and Whirlpool washers and dryers are recommended most often by salespersons at major U.S. appliance retailers.

    Kitchen Appliances Study
    The Kitchen Appliance Satisfaction Study measures customer satisfaction in three product categories: refrigerators; dishwashers; and cooktops/ranges/ovens.  Customer satisfaction is measured based on performance in six factors: performance and reliability (including how well the appliance functions, noise level and energy efficiency); features (such as the usefulness of settings available and appliance capacity); ease of use; styling and appearance; price; and warranty.

    Refrigerators
    Sub-Zero ranks highest in satisfying refrigerator owners with a score of 834 and performs particularly well in five of the six factors: ease of use, performance and reliability; styling and appearance; features; and warranty. Following Sub-Zero in the ranking are Samsung (820) and LG (790). Samsung performs particularly well in the price factor.

    Mystery shoppers indicate that, among refrigerator brands, Samsung receives particularly high recommendation rates from major appliance retailer salespersons.

    Dishwashers
    Miele ranks highest in customer satisfaction with dishwashers for a second consecutive year with a score of 814 and performs particularly well in two factors: performance and reliability and warranty. Following Miele in the ranking are Fisher & Paykel (805) and Kenmore Elite (802). Fisher & Paykel performs particularly well in the styling and appearance and features factors, while Kenmore Elite performs well in the ease of use factor.

    Kenmore dishwashers receive notably high rates of salesperson recommendations, according to mystery shoppers.

    Cooktops/Ranges/Ovens
    Among manufacturers of cooktops, ranges, and ovens, LG and Wolf rank highest, in a tie (804 each). This is the second consecutive year that Wolf receives an award in the cooktops/ranges/ovens segment. Wolf performs particularly well in three of the six factors: ease of use; performance and reliability; and styling and appearance. Ranking third in the segment is GE Monogram (801).

    Mystery shoppers indicate that appliance retailer salespersons provide high rates of recommendations for GE ranges.

    The 2011 Laundry Appliance Satisfaction Study is based on responses from more than 5,600 customers who purchased clothes washers and more than 5,500 customers who purchased clothes dryers during the past 24 months. The study was fielded between March and April 2011.

    The 2011 Kitchen Appliance Satisfaction Study is based on responses from more than 4,000 customers who purchased dishwashers, more than 4,300 customers who purchased cooktops/ranges/ovens and more than 5,000 customers who purchased refrigerators during the previous 24 months. The study was fielded between March and April 2011.

    The 2011 Appliance Mystery Shopping Report compiles the findings of 600 trained mystery shoppers who performed either on-site or telephone evaluations of a major U.S. appliance retailer. The report is released quarterly; Q2 2011 results are based on evaluations collected between April and June 2011. Major appliance retailers included in the report are Best Buy, hhgregg, The Home Depot, Lowe’s and Sears.

    About JD Power and Associates
    Headquartered in Westlake Village, Calif., JD Power and Associates is a global marketing information services company operating in key business sectors including market research, forecasting, performance improvement, Web intelligence and customer satisfaction.  For more information on car reviews and ratings, car insurance, health insurance, cell phone ratings, and more, please visit JDPower.com. JD Power and Associates is a business unit of The McGraw-Hill Companies.

    About The McGraw-Hill Companies
    Founded in 1888, The McGraw-Hill Companies is a leading global financial information and education company that helps professionals and students succeed in the Knowledge Economy.  With leading brands including Standard & Poor’s, McGraw-Hill Education, Platts energy information services and JD Power and Associates, the Corporation has approximately 21,000 employees with more than 280 offices in 40 countries.  Sales in 2010 were $6.2 billion.  Additional information is available at http://www.mcgraw-hill.com.

    No advertising or other promotional use can be made of the information in this release without the express prior written consent of JD Power and Associates. /corporate


    # # #


  • 2011 Home Appliance Retailer Study

    Customer Satisfaction with Major Appliance Retailers Hinges More on Sales, Delivery and Installation Service than on Facilities, Merchandise and Price

    2011-08-03

    jdp-root

    WESTLAKE VILLAGE, Calif.: 3 August 2011 — Service-related aspects of major appliance retailers–including sales, delivery and installation services–are slightly more important to overall satisfaction than facility, product and price, according to the JD Power and Associates 2011 Appliance Retailer Satisfaction StudySM released today.


    The study, now in its fourth year, measures customer satisfaction with the largest appliance retailers based on performance in six factors: sales staff and service; store facility; merchandise (i.e., variety of brands/models offered and availability of merchandise and product information); price, delivery service; and installation service.


    Combined, the importance weights of the sales staff and service; delivery service; and installation service factors slightly exceed the combined importance of the store facility, merchandise and price factors (51% vs. 49%, respectively). Courtesy of the sales staff is the most important aspect within the sales staff and service factor, while courtesy of delivery personnel is the most important element of delivery service.


    “Appliance retailers often try to compete on price and merchandise, but the main differentiator when it comes to satisfaction is having knowledgeable and courteous staff available to assess and help meet customer needs,” said Jim Howland, senior director of the real estate and construction practice at JD Power and Associates.


    Lowe’s ranks highest in customer satisfaction with appliance retailers for a second consecutive year, achieving a score of 807 on a 1,000-point scale. Lowe’s performs particularly well in four of the six factors: store facility; price; delivery service; and installation service. Following Lowe’s in the ranking are hhgregg (799) and Sears (793). Hhgregg performs particularly well in the sales staff and service and merchandise factors.


    The highest-ranking appliance retailer brands demonstrate particular strength in certain key operational metrics, according to the JD Power and Associates 2011 Appliance Mystery Shopping Report.SM


    • Sales staff at hhgregg, Lowe’s and Sears each perform better than average in quickly providing assistance to mystery shoppers.

    • Over the telephone, staff at Lowe’s and Sears perform well in assessing customer needs, and are more likely than staff at other retailers to ask about the customer’s budget and appliance use habits.

    • Staff at Lowe’s are more likely than staff at other retailers to mention their brand’s store advantages to telephone mystery shoppers.

    • Retailers hhgregg and Sears have the highest ratings for salesperson personality (ratings of excellent/truly exceptional).

    The 2011 Appliance Retailer Study is based on responses from more than 4,400 customers who purchased a laundry or kitchen appliance within the previous 24 months from a major appliance retailer. The study was fielded between March and April 2011.


    The 2011 Appliance Mystery Shopping Report compiles the findings of 600 trained mystery shoppers who performed either on-site or telephone evaluations of a major U.S. appliance retailer. The report is released quarterly; Q2 2011 results are based on evaluations collected between April and June 2011. Major appliance retailers included in the report are Best Buy, hhgregg, The Home Depot, Lowe’s and Sears.


    About JD Power and Associates
    Headquartered in Westlake Village, Calif., JD Power and Associates is a global marketing information services company operating in key business sectors including market research, forecasting, performance improvement, Web intelligence and customer satisfaction.  The company’s quality and satisfaction measurements are based on responses from millions of consumers annually.  For more information on car reviews and ratings, car insurance, health insurance, cell phone ratings, and more, please visit JDPower.com. JD Power and Associates is a business unit of The McGraw-Hill Companies.


    About The McGraw-Hill Companies
    Founded in 1888, The McGraw-Hill Companies is a leading global financial information and education company that helps professionals and students succeed in the Knowledge Economy.  With leading brands including Standard & Poor’s, McGraw-Hill Education, Platts energy information services and JD Power and Associates, the Corporation has approximately 21,000 employees with more than 280 offices in 40 countries.  Sales in 2010 were $6.2 billion.  Additional information is available at http://www.mcgraw-hill.com.


    No advertising or other promotional use can be made of the information in this release without the express prior written consent of JD Power and Associates. /corporate


    # # #