Wealth Intelligence Report
June 2023


Investor Confidence Begins to Stabilize Amid Bank Crises and Persistent Inflation

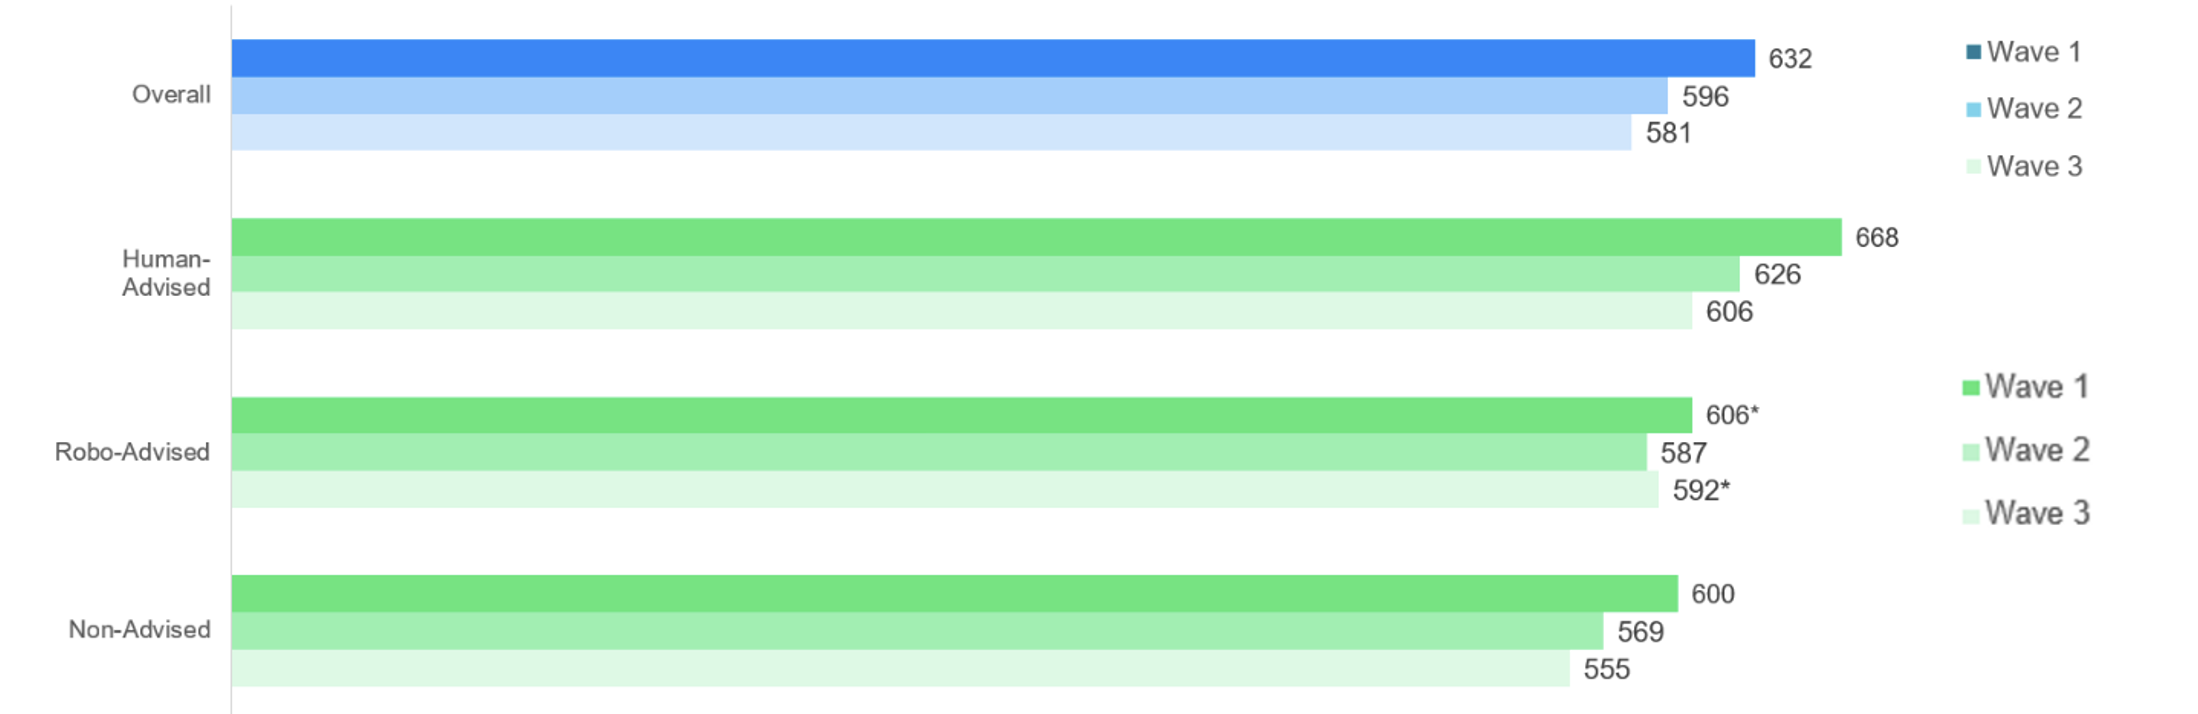
Investor confidence may have reached an inflection point. According to the JD Power U.S. Investor Confidence Index, which tracks investor sentiment among U.S. consumers aged 18 and older with at least $100,000 in investable assets, investor confidence has begun to stabilize, as it improved 89 points to 590 (on a 1,000-point scale) in Q1 2023.

This gain—which recoups more than half of the drop from Q3 to Q4 2022—is significant, as it comes amid a backdrop of economic volatility that has included the collapse of multiple financial institutions. Still, only 9% of investors are planning to decrease investment during the next three months and nearly 80% say they feel “better off” or “about the same” about their financial situation as they did a year ago.  

Inflation Still an Issue

While the ability to keep up with inflation is once again the area of lowest confidence among all investor segments, regardless of age, affluence, gender or whether they are self-directed or work with an advisor, there is cause for some optimism. At the time of fielding, inflation had eased to 5% from the all-time high of 9.1% in June 2022, and that seems to be reflected investor sentiment. Overall, 29% say they are highly confident in their ability to keep up with inflation, up from 24% in Q4 2022 and the highest rate of confidence since Q2 2022.

gap in percentage of wave 4 vs wave 1

Female investors have significantly lower Investor Confidence Index scores than men (562 vs. 620, respectively). Also, for a fourth consecutive quarter, Gen Z[1] and Millennial investors show notably higher levels of confidence than members of Gen X and Boomers.

chart showing confidence index


Handling the Bank Crises

The collapse of Silicon Valley and Signature Banks—and, after this wave was fielded, First Republic Bank—did stoke some investor concerns. When asked about the collapses, nearly two-thirds (66%) “somewhat agree” or “strongly agree” that their concerns about the stability of the financial system increased by the collapses.


chart showing increasing concern about financial stability

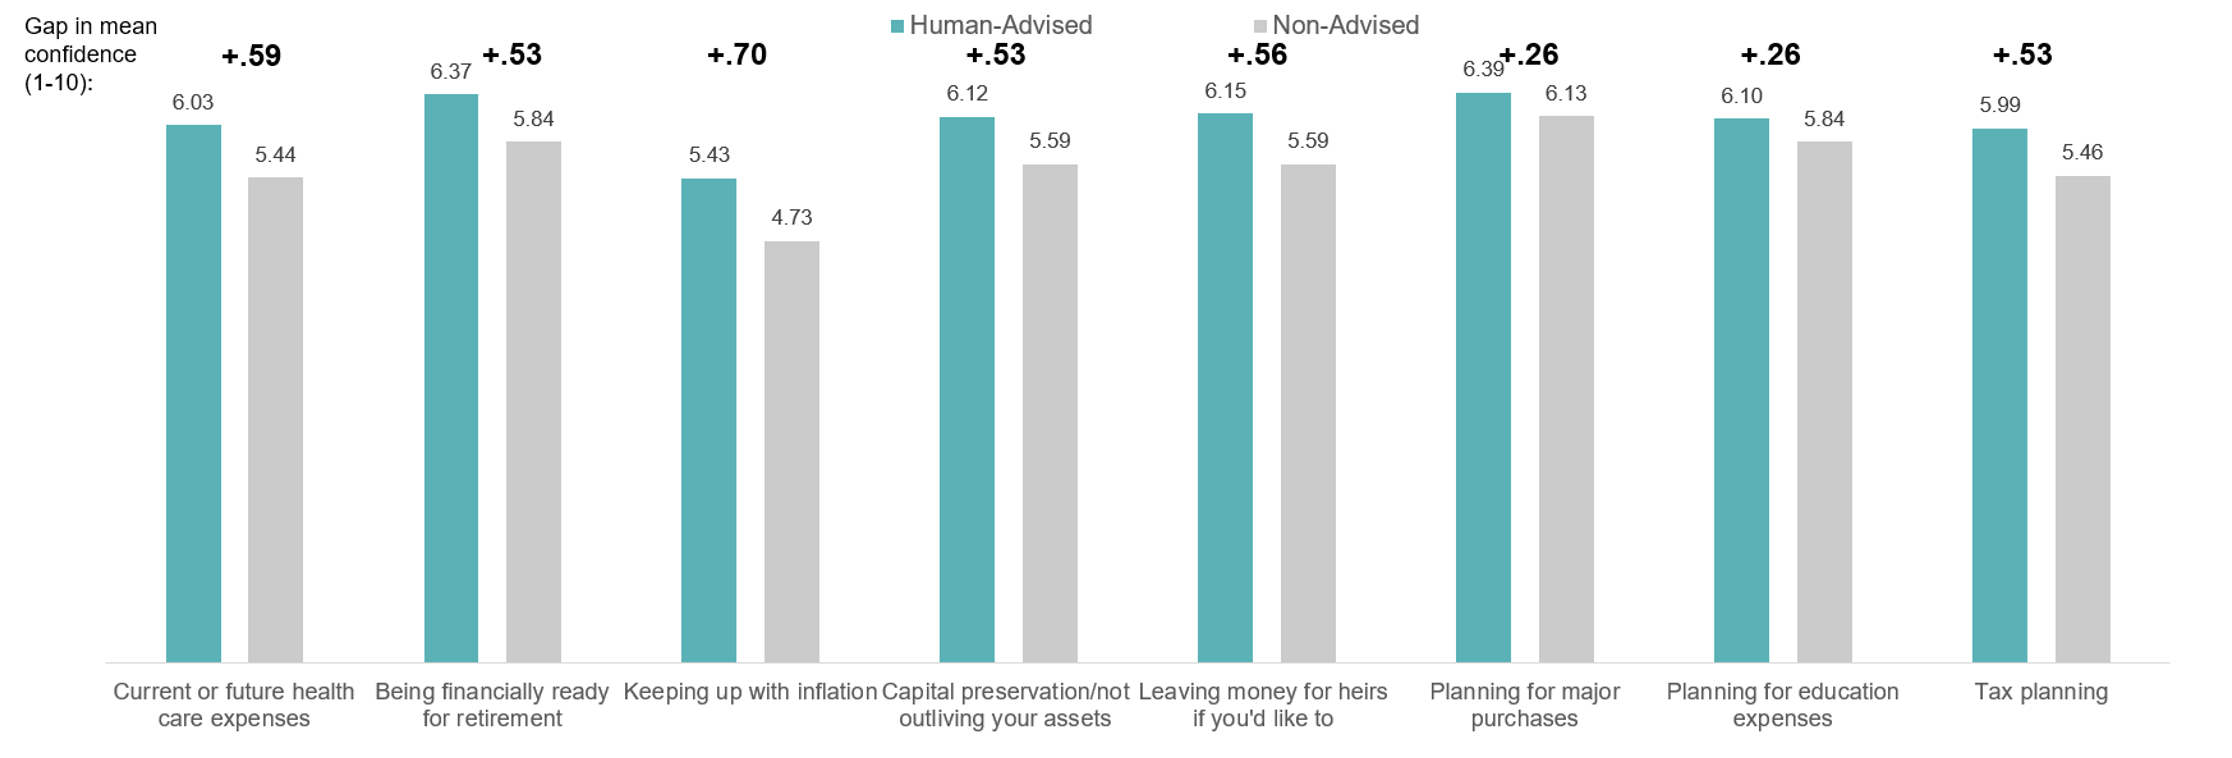
Surprisingly, more than half (53%) of advised investors say they were not contacted by their primary firm about the bank failures. Those firms that did make contact seemed to have done an adequate job quelling any fears, as 71% say the communication from their firm made them feel more positive about the issue.

chart showing communication of financial institutions

Making Modest Gains

Even with concerns about bank stability, most investors remain optimistic about their personal financial situation. More than three-fourths (79%) of investors feel better off or the same about where they are financially vs. a year ago, and 91% of investors plan to maintain or increase their contributions in the next three months.

chart about feeling better or worse off financially


While investors once again view their personal financial outlook more favorably than the economy, both metrics increased during last quarter, showing some modest gains that may start to mount into some forward momentum.

chart showing majority of people feel average about the outlook of the economy


On the Edge of Optimism

Even amid these bank collapses and sustained high levels of inflation, the stabilizing trend in investor confidence is an encouraging sign. As investors plot their next moves, advisors can benefit from being proactive in their client communications—specifically around any economic news, negative or positive—to help build a rapport and a trust that will strength relationships ahead of future investments. 

Find out More

This Wealth Intelligence Report is based on responses from 1,873 U.S. consumers aged 18 and older with at least $100,000 in investable assets. The most recent wave was fielded from March 23-April 7, 2023. Previous waves were fielded between May 27, 2022-June 17, 2022; September 12, 2022-September 26,2022; and December 19, 2022-January 6, 2023. It was authored by Craig Martin, managing director and global head of wealth and lending intelligence at JD Power. Please contact us at the numbers below to connect with Mr. Martin or to learn more about the underlying research.


Media Contacts

Brian Jaklitsch; East Coast; 631-584-2200; [email protected]

Geno Effler, JD Power; West Coast; 714-621-6224; [email protected]


[1] JD Power defines generational groups as Pre-Boomers (born before 1946); Boomers (1946-1964); Gen X (1965-1976); Gen Y (1977-1994); and Gen Z (1995-2004). Millennials (1982-1994) are a subset of Gen Y.

MAXIMIZING ADVISOR ENGAGEMENT AND ROI:

Data-Driven Strategies for Content Delivery & Development from 4U & JD Power

As a wealth management professional, you know that effective advisor engagement is crucial for driving ROI on content development and delivery. But how do you know which strategies will work best for your business?

In this webinar, founder and co-CEO Denise Wypiszenski will share proprietary insights that will enable data-driven decisions in content development and wholesaler engagement. She will also draw on insights from the JD Power 2022 Advisor Online Experience Study to provide you with a comprehensive understanding of the advisor landscape.

Here’s what you’ll learn:

  • How to quickly deliver the content advisors need to succeed
  • Which content is most important to advisors
  • How to adapt to the changing engagement landscape
  • Strategies for understanding and connecting with your advisor audience
  • How to measure success and drive ROI on your site

Click to watch the webinar now.

https://hub.jdpower.com/maximizing-advisor-engagement-and-roi-webinar

In the continuing battle for customer loyalty and investment dollars, it’s clear that financial institutions must continue to provide quality content and services on their mobile apps. This was made abundantly clear by the 2022 JD Power U.S. Wealth Digital Experience Study, which found that half (50%) of Gen Y and Gen Z investors in the U.S. are turning to their primary investment firm’s mobile app for educational content. This reflects a clear appetite for more financial education.

Half of Gen Z and Gen Y investors are turning to their primary investment firm's mobile app for investment education

Evaluating Financial Wellness

Just 39% of pandemic-era investors (those who started investing in 2020) can be classified as financially healthy, compared with 72% among more tenured investors, according to our 2022 Self-Directed Investor Satisfaction Study. Brokerage firms need to make financial literacy a priority, as financially vulnerable clients have significantly lower satisfaction with their firms and are more likely to defect and less likely to recommend.

What Education Is Most Valuable for Clients?

JD Power research shows that firms can improve satisfaction and brand loyalty by doing a better job of delivering content, tools and services that teach clients to:

  • Effectively manage investments in the context of their overall financial lives;
  • Overcome the challenges of paying bills on time;
  • Manage debt in a challenging economy;
  • Develop a savings plan to cover six months or more of living expenses.

Using Wealth App to Educate Investors

“Wealth management firms that want to attract and retain younger investors need to focus on continuing to improve their apps,” said Michael Foy, senior director of wealth intelligence at JD Power. With increasing competition in the wealth management space from banks and fintechs, investors have increasingly high expectations about digital channels. In addition to their practical utility, these apps are also playing an important role in financial literacy.

Questions for wealth digital channel directors, strategy leaders and customer experience management teams:

  • How can I develop scalable ways to meet the demand for advice and guidance investors with very different needs and levels of knowledge?
  • What is the best way to balance human and digital interactions to best support clients?
  • How can I improve brand loyalty through digital channels?

Wealth Digital Channel Development

Will investors continue to turn to firms for financial literacy? In the 2023 Self-Directed Investor Study, JD Power will explore investors’ actual state of financial literacy and how well brands are doing to help educate and enable them to make better financial decisions. By doing so, we’ll help ensure that these young investors stay loyal to the financial institutions that they trust for the long haul.

Wealth Intelligence Report
February 2023

Investor Confidence Sinks for Second Consecutive Quarter, but 91% Plan to Maintain or Increase Investment

Great opportunity often arises in turbulent times, which may explain why, despite individual investor confidence declining for a second consecutive quarter, fewer than one-in-ten investors (9%) are planning to decrease investment in 2023.  

According to the JD Power U.S. Investor Confidence Index, which tracks investor sentiment among U.S. consumers aged 18 and older with at least $100,000 in investable assets, investor confidence has fallen 15 points to 581 (on a 1,000-point scale) in Q4 2022. While that drop is noteworthy, it is significantly smaller than the 36-point drop we observed in Q3 from Q2. That slowing trend, combined with the 91% of investors who say they plan to maintain or increase their current investments, could suggest some optimism bubbling beneath the surface, or at least a lack of panic about where markets are heading.

Inflation Remains a Factor

Once again, the biggest single factor contributing to the quarterly decline in investor confidence is growing concern with the ability to keep up with inflation. Among all eight key drivers of investor confidence, the ability for investors to keep up with inflation is the area of lowest confidence among all segments, regardless of age, affluence, gender or whether or not they are self-directed or work with an advisor. Overall, just 24% say they are highly confident in their ability to keep up with inflation, down from 27% in Q3.

chart1

Female investors have significantly lower Investor Confidence Index scores than men (547 vs. 605, respectively). Also, for a third consecutive quarter, younger investors in the Generation Z[1] and Millennial segments show notably higher levels of confidence than members of Generation X and Boomers. Boomers, however, express a slight increase to Q3 (569) from Q2 (567).

chart2

The Human Touch

Both overall confidence levels and key drivers of overall confidence vary significantly between investors who work with a financial advisor and those who do not. Human-advised investors have higher overall confidence (606) vs. Non-Advised (555) or Robo-Advised (592).

chart3

That trend stays consistent across every factor in the Index. The three areas in which human-advised investors express more confidence than self-directed investors are the perceived ability to keep up with inflation, pay for current or future healthcare expenses, and leaving money to heirs.


chart4

The Bubbling Optimism

Despite the challenging environment, most investors remain optimistic about their personal financial situation. Nearly three-fourths (73%) of investors feel better off or the same about where they are financially vs. a year ago, and 91% of investors plan to maintain or increase their contributions in the next three months.


chart5

While investors view their personal finance outlook more favorably than the economy, there have been small increases in both metrics between Q3 and Q4, indicating that broad based economic sentiment may slowly be starting to shift direction.


chart6

The Next Chapter

While there is undoubtedly still concern that turbulent economic conditions will linger into 2023—and investors are clearly concerned about it—the majority of U.S. wealth management clients are planning to stay the course. There is still a long way to go but, based on the data in our Investor Confidence Index, the investor outlook for 2023 may end up being less about panic and more about finding opportunities for strategic growth.

Find out More

This Wealth Intelligence Report is based on responses from 1,919 U.S. consumers aged 18 and older with at least $100,000 in investable assets. It was fielded from December 19, 2022-January 6, 2023. It was authored by Michael Foy, senior director of wealth intelligence at JD Power. Please contact us at the numbers below to connect with Mr. Foy or to learn more about the underlying research.


Media Contacts

Brian Jaklitsch; East Coast; 631-584-2200; [email protected]

Geno Effler, JD Power; West Coast; 714-621-6224; [email protected]


[1] JD Power defines generational groups as Pre-Boomers (born before 1946); Boomers (1946-1964); Gen X (1965-1976); Gen Y (1977-1994); and Gen Z (1995-2004). Millennials (1982-1994) are a subset of Gen Y.

It’s critical for wealth management brands that want to remain competitive – especially to attract and retain next-generation investors – to deliver an exceptional digital experience. And with the digital landscape changing so quickly, strategically aligning investments in digital improvements with investor priorities and preferences is vital. 

We pinpoint the factors that matter most to investors using digital channels and drive their satisfaction so that you can understand the digital needs, expectations, and desires of today’s full-service and self-directed investors.

Watch the 2022 U.S. & CA Wealth Management Digital Experience Study Results >>>>>>

Despite the massive, industry-wide disruption caused by the COVID-19 pandemic, booming financial markets and significant gains in production have boosted overall financial advisor satisfaction this year. But not all advisors are feeling the warm glow of support from their firm. According to the JD Power 2021 U.S. Financial Advisor Satisfaction Study,SM released this week, advisors working for wirehouse firms1 generally indicate having significantly lower levels of support from their firm, greater disruption of business services and more difficulty transitioning to remote work than do those advisors working for non-wirehouse and independent advisory firms.

“Advisor satisfaction is directly linked to retention and brand advocacy, so firms that want to get the most out of their advisors need to invest in providing them with the best tools and support to do their jobs effectively under all circumstances,” said Mike Foy, senior director of wealth and lending intelligence at JD Power. “This year has been especially challenging, and this study identifies some firms that clearly did a better job than others in meeting those challenges.”

Following are some key findings of the 2021 study:

  • Wirehouses fall short of advisor expectations: Despite payout rates and branding campaigns that suggest higher levels of support for advisors, wirehouse firms have fallen short of advisor expectations during the pandemic, with 34% of wirehouse advisors reporting reduced levels of support from the home office and 29% citing disruption of business services. In both cases, wirehouse advisors have experienced negative effects from the pandemic at approximately double the rate of non-wirehouse and independent advisors. Wirehouse advisors also cite higher levels of difficulty transitioning to remote work. Morgan Stanley is an exception as the only wirehouse that significantly improves from 2020. 
     
  • Dissatisfied advisors more than three times as likely to switch firms: Tracking firm-level advisor satisfaction scores from 2018 through 2021, JD Power finds that 18% of advisors working for firms with the lowest overall advisor satisfaction scores ended up switching firms during that period. That compares with a switch rate of just 5% among the firms with the highest overall advisor satisfaction scores. The average annual production of defecting advisors is nearly $800,000 per year, and 63% of investors indicate they would likely leave their firm to follow their advisor if he/she left the firm.2
  • Advisor satisfaction strongly linked to Net Promoter Score® (NPS)3Across all advisor segments, satisfaction is strongly linked to advocacy as well as retention. Among the nearly one-third (32%) of advisors whose satisfaction is above 900 (on a 1,000-point scale), nearly all will promote their firm (NPS=97). Just 2% say they plan to leave their firm.
     
  • Technology and operations support are common pain points for dissatisfied advisors: Among advisors who provide the lowest NPS scores, the most significant pain points are technology and operations support. Just 35% of these dissatisfied advisors say their firm’s technology offerings have improved in the past year and just 12% have had problem-free experiences with their firm during the past year.

Read the full press release here to find out who ranked highest in overall satisfaction among employee advisors and independent advisors

The JD Power U.S. Financial Advisor Satisfaction Study helps wealth management firms understand how effectively profiled firms are servicing their affiliated financial advisors – both employee advisors and independent advisors. Delivering a financial advisor experience that maximizes both loyalty and productivity is critical for success, given the risk of dissatisfied advisors taking clients to a competitor.

Join our mailing list to get updates on the study and learn how you can subscribe to the study. 

For more information about the U.S. Financial Advisor Satisfaction Study, visit https://www.jdpower.com/business/resource/us-financial-advisor-satisfaction-study.

1Merrill, Morgan Stanley, UBS and Wells Fargo Advisors
2Data is from JD Power 2021 U.S. Full-Service Investor Satisfaction StudySM
3Net Promoter,® Net Promoter System,® Net Promoter Score,® NPS,® and the NPS-related emoticons are registered trademarks of Bain & Company, Inc., Fred Reichheld and Satmetrix Systems, Inc.

FSI is the longest-running and most in-depth, independent survey of clients whose investments are directed by an advisor. JD Power has provided clear, objective intelligence about this group of investors for two decades and the study has undergone a number of redesigns to innovate and evolve alongside the dynamic marketplace it studies. We’re sharing some of the headlines and key findings from over the years in anticipation of the 20th edition hitting the headlines on March 23, 2022. 

2022 marks the 20th consecutive year of the JD Power U.S. Full-Service Investor Satisfaction Study (FSI). 

What’s changed in the industry over the years?

  • Competitive landscape: Less than half (10 of 21) of firms ranked in the full-service investor study back in 2002 are still in operation under the same brand name twenty years later. Many others were acquired, with a spike in M&A activity in the aftermath of the financial crisis in 2008.
  • Digital engagement: Back in 2002 using an investment website probably meant you worked with a “discount broker”, and the App Store didn’t even exist, but by 2021 83% of full-service investors regularly login to their firm’s website, and more than half (51%) use their app.
  • Consumer choices: Two decades ago your basic choices as an investor were either to work with a traditional advisor or do it yourself with a discount brokerage firm.  Today there are digital or robo-advisors, virtual advisors, call center advisors, and a range of different ways to pay for the services that you truly need and value.

What’s stayed the same?

  • Value of Trust: Two decades ago, the U.S. was emerging from 9-11 and the economic volatility it created; today we’re emerging from a very different kind of crisis, but the importance of investor trust in their advisor and firm remains constant across time.
  • The Primacy of Personal Relationships: The most impactful KPIs in the study over the years have always focused on the clients’ personal relationship with their advisor, and specifically how well advisors understand and help plan to meet personal goals, provide clear explanations of complex subjects and are reliable and responsive.
  • Fee Confusion:  Despite all the industry and regulatory efforts to provide greater pricing transparency and communication over the years, more than half (47%) of clients still don’t completely understand their fees, which remains a risk to the industry especially as alternatives and competitors continue to proliferate.


A Look Back at 20 Years of Investor Insights and Trends:


Much has been made of the great wealth transfer and the opportunity for advisors to manage some of the estimated $70 trillion that will pass from boomers to the next generation over the next 20 years. There has been extensive dialogue on how the next generations differ and what advisors need to do to connect with the younger cohort. The importance of ESG, crypto investments, fielding younger advisors, more casual attire, and perhaps most commonly, the adoption of digital engagement, are bandied about.   

However, in our research we have found that for all the analyses of generational quirks and preferences, when it comes to what younger clients value in financial advice, they often have a lot more in common with their elders than not It’s when we examine how they perceive the experience of receiving great and valuable advice that disturbing cracks appear between the generations.

Read the full article on Barrons.com>>  

The Wealth Management industry has made great progress over the last decade. It was not long ago when pitching stocks to strangers over the phone was the norm. Now, a combination of increased expectations on the part of consumers, regulators and the industry itself have propelled wealth management to new heights where client-centric and comprehensive advice has become a business fundamental.

While this growth is a significant accomplishment, the industry still has a long way to go before it reaches peak customer centricity. To borrow a mountain climbing analogy, the industry has reached base camp at Mount Everest. That’s nothing to scoff at. It is a multi-week venture that starts in Nepal, requires a flight from Katmandu across the Himalayans to a small moun­­­tain airstrip in Lukla and then a weeklong trek beginning at an elevation of 9,000 ft and 60 miles later ending at over 17,000 ft. All along the way you experience a majestic backdrop of four of the highest mountains in the world, the skill and hospitality of the renowned Sherpa’s, narrow winding trails and the acclimatization to oxygen levels 50% of that at sea level. Many say this is a bucket list trip for the mountain adventurer.

Yet is still only halfway up the mountain.

Research shows that the wealth management industry is also only halfway up the mountain. Despite great progress, the JD Power 2021 U.S. Full Service Investor Satisfaction Study found that more than half of clients (56%) said their advisor did not provide all the products and services needed to address all their wealth management needs, a third (33%) said that their advisor did not understand their financial goals/needs and used terms they didn’t understand, 53% said they did not completely understand the fees being charged.

There is a gap between where the industry is and its full potential.

Is this ok? Is halfway up the mountain or the Latin translation, mediocris, an acceptable destination? I think industry leaders would agree that the answer is a resounding no.

What we do as an industry is too important. The impact of good financial advice is too profound. The ripple effect is too pronounced.

Good financial advice can change lives. Good decisions and planning today can markedly affect an individual’s future and that of their family, community and even society at large. Making good financial decisions gives a person the power and control to affect their future and good financial planning provides clarity on how to get there. The value of this cannot be overstated.

The effect one can have on many is extensive, our ripple effect goes far and wide. It’s been said that an individual, on average, will know 1,000 people in their lifetime. This means that an individual is only one person removed from 1,000,000 people. And when you influence someone you not only influence that person today you influence the “collective” person. The community made up of that person today and who they are in all their future iterations. The effect of our willingness to strive beyond ok is quite profound and almost beyond comprehension. What we do matters and often more than we realize.

We know as an industry that we need to keep climbing and as the research shows there are specific areas of improvement where we need to train our focus:

  1. Embracing an unwavering commitment to the client and fiduciary responsibility. This is good for everyone, the client, the financial advisor’s success and all those that support them.
  2. Adopting a true advisory process. There is a place for selling, but the day-to-day role with clients must be to advise. To help clients make decisions that align with their values, goals and aspirations and to help them act on those decisions.
  3. Gaining a deep understanding of the client’s life and what is most important to them. Adopt the practice of inquiry to help uncover the truth, both the knowns and unknowns, about a client’s values, goals and aspirations.
  4. Delivering comprehensive advice.  Address the entirety of client wealth management and financial planning needs. Incorporate the expertise needed to accomplish this through teaming and strategic partnerships.
  5. Leverage technology to provide anytime anywhere access to information and to model the future. Provide the ability to explore multiple paths and future possible outcomes.
  6. Creating unmistakable and remarkable value. Leave no doubt as to the profound impact financial advice, and all the expertise that goes into it, has on a client’s wellbeing. Today and in the future.

The wealth management industry has made real and significant progress in serving clients, transitioning over years from a transactional commission-based culture to one that values and supports more comprehensive client-centric fee-based client relationships. That is long trek from where the industry started, but we’re not at the summit.

No one in the industry aspires to be mediocris yet one can be lulled into accepting the status quo. The long trek to base camp is a significant accomplishment yet there is still further to go.

And the last and pivotal part of the journey is often the hardest part.

For the well-trained and experienced mountaineer, reaching the peak of Mt. Everest is a pursuit worthy of the time, sacrifice, energy and expense needed to realize the goal. The same can be said for the wealth management industry and the effort, time and resources needed to realize the full potential. Halfway or mediocris is not acceptable. Striving beyond halfway takes real intention and continual effort.  

So where are you on the journey? What are your opportunities to impact the financial advice value chain and improve the client experience and their outcomes? How can you change the pace or trajectory of the ascent to the peak?

Remember what you do can make a big difference.

Many financial advisory firms are rethinking their talent management strategies, with a focus on serving a more diverse and dynamic set of future clients.


By Bailey McCann


When it comes to talent management, financial advisory firms are facing a number of challenges.

To begin with, the advisory workforce skews older than many other professions, and many of the most successful professionals are nearing retirement age and considering an exit plan. Meanwhile, during the pandemic, those in the early or middle stages of their career got used to a new level of autonomy and flexibility that may not remain the norm.

Attracting new talent to the field is also difficult, and few collegiate programs are dedicated to financial planning and proactively bring new people into the field. Taken together, these factors are requiring financial advisory firms to rethink talent management in order to attract and retain talent—as is the pressing need to improve the diversity of the adviser industry workforce.

Future-Proofing
As PLANADVISER recently reported, JD Power’s “2022 U.S. Financial Advisor Satisfaction Study” shows that adviser attrition risk has increased this year across all categories, with 15% of advisers at wirehouse firms and 7% of independent advisers now categorized as “at risk” of leaving their firms in the next two years.

Read the full article on planadviser.com>> 

Wealth Intelligence Report
October 2022


Investor Confidence Plunges, but Majority Plans to Stay the Course

With the S&P 500 down more than 23% through the end of September 2022, inflation up 8.2% during the same period and a looming recession, investors are starting to lose confidence in their ability to manage their overall financial lives.

According to the JD Power U.S. Investor Confidence Index, which tracks quarterly investor sentiment among U.S. consumers aged 18 and older with at least $100,000 in investable assets, investor confidence has fallen 37 points to 596 (on a 1,000-point scale) in Q3 2022. Despite the decline, 89% of investors say they plan to maintain or increase investment accounts over the next three months.


Inflation Rears its Head

The biggest single factor contributing to the quarterly decline in investor confidence is growing concern with the ability to keep up with inflation. Overall, just 27% of investors say they are highly confident in their ability to keep up with inflation. That’s down from 35% in the Q22022 Investor Confidence Index.

Across all affluence segments, ranging from investors with $100,000 in investable assets to those with $1 million or more, keeping up with inflation scored significantly lower than factors such as capital preservation, planning for major purchases or preparing for retirement.


graph showing inflation

Digging deeper into investor demographics, female investors have significantly lower Investor Confidence Index scores than men (553 vs. 628, respectively) and younger investors in the Generation Z[1] and Millennial segments show notably higher levels of confidence than members of Generation X and Baby Boomers.


graph 2


Staying the Course on Future Investment Plans

While the percentage of investors who say they will increase their investments during the next three months has dropped to 28% today from 34% in the Q2Investor Confidence Index, the majority of investors are staying resilient. Across all demographic groups, 89% of investors say they plan to maintain or increase their short-term investment. Similarly, 71% say they feel better or the same about where they are financially versus a year ago.


graph 3


Weighing the Role of the Advisor

While investor confidence has declined sharply this quarter, that decline is less pronounced among full-service investors (i.e. those who work with a dedicated financial advisor in their primary relationship). The average overall investor confidence score for investors with full-service advisors is 622. That number falls to 589 among those working with robo-advised accounts and 572 among self-service investors.

Graph


Find out More

This Wealth Intelligence Report is based on responses from 1,929 U.S. consumers aged 18 and older with at least $100,000 in investable assets. It was fielded from September 12-September 26, 2022. It was authored by Michael Foy, senior director and head of wealth intelligence at JD Power. Please contact us at the numbers below to connect with Mr. Foy or to learn more about the underlying research.


Media Contacts

Brian Jaklitsch; East Coast; 631-584-2200; [email protected]

Geno Effler, JD Power; West Coast; 714-621-6224; [email protected]


[1] JD Power defines generational groups as Pre-Boomers (born before 1946); Boomers (1946-1964); Gen X (1965-1976); Gen Y (1977-1994); and Gen Z (1995-2004). Millennials (1982-1994) are a subset of Gen Y.

Banking and Payments Intelligence Report
October 2022

Are Americans Adjusting to Inflation?

Inflation isn’t going away anytime soon. But according to the latest JD Power data, some signals suggest that Americans are getting a better handle on how to manage their finances in the face of challenging economic conditions.

According to the data, the share of American banking customers now classified as financially healthy[1] increased four percentage points, this month, the largest increase in nearly a year. What’s more, number of customers that said the cost of goods increased faster than their income fell for the first time since we began tracking the metric in March 2022.

While the improvement is modest—and a significant majority of American consumers are still experiencing financial difficulties—supporting data suggest that many Americans are starting to change their spending habits to adapt to rising prices.

Financial Health Improves Slightly

Although it is still too early to call it a rebound, some key indicators of financial health are starting to show month-to-month improvement. Notably, 34% of U.S. bank customers are now classified as financially healthy, up four percentage points from July.

Chart depicting financial health across banks


Meanwhile, the percentage of banking customers who said the price of goods is increasing faster than their income, decreased one percentage point to 71% in August.  

The price of things is increasing more than my salary


Spending, Budgeting, and Saving Strategies Evolve

Americans also seem to be adjusting their spending to mitigate the stress caused by inflation. Currently, 86% of consumers say they are taking action to manage inflation in their lives today with steps such as increased budgeting, buying fewer items to stay on budget and increasing savings to safe for future services. For example, in October 2021, 12% of bank customers told JD Power that they do not have a budget. In August, that number fell to just 8%.

The biggest changes in consumer spending behaviors are focused on dining options and discretionary spending on items such as clothing.

Prices are rising


While Americans are reining in spending, it seems that they are backing off some of the emergency measures they took over the summer.  The number of Americans that reduced their savings to pay for immediate expenses decreased month over month, as did the percentage of those that experienced increased need for credit to pay for immediate needs.

bar graphs


Banks to the Rescue?

While banking customers try to navigate this financial landscape, banks are still slow to offer solutions that are making a meaningful difference. One-fourth (25%) of customers wish they received information from their bank about strategies and tool to manage inflation, save in a recession or pay down debt in a recession.

Graph showing who uses tools to monitor debt

When asked what banks could do to make products compelling enough to use, Americans were quick to mention rewards, such as cash back, higher-yield rates and discounted fees (34%). Also, 13% said they would like to be emailed a link explaining benefits of such a tool, and 8% want to be walked through their options at a local branch.

Graph showing banking solutions to financial issues caused by inflation


Guiding to the Light

While the overall outlook on American financial health is still far from optimistic, the behavioral changes we are seeing in the data suggest many Americans are starting to adapt to the current inflationary environment.

For as long as that challenging economic environment persists, banks have an opportunity to make meaningful inroads in their relationships with their customers. Now more than ever, customers are looking to their financial institutions for guidance, and are receptive to programs banks have long been after customers to adopt. Handled properly, the current economic downturn could present an opportunity for banks to earn goodwill and advocacy by helping customers address their pain points.

Find out More

This Banking and Payments Intelligence Report is based on responses from 4,000 retail bank customers nationwide and was fielded in August 2022. It was authored by Jennifer White, senior director of banking and payments intelligence at JD Power. Please contact us at the numbers below to connect with Ms. White or to learn more about the underlying research.


Media Contacts

Brian Jaklitsch; East Coast; 631-584-2200; [email protected]

Geno Effler, JD Power; West Coast; 714-621-6224; [email protected]


[1]  JD Power measures the financial health of any consumer as a metric combining their spending/savings ratio, creditworthiness, and safety net items like insurance coverage. Consumers are placed on a continuum from healthy to vulnerable.